
The visual calculations in Power BI They are changing the way users analyze data. Now it's possible to create year-over-year comparisons, accumulations, and advanced metrics directly on charts and tables, without needing to write DAX formulas.
If you work with sales reports, financial indicators, or business dashboards, this new feature can help you get valuable insights in seconds and reduce dependence on technical users.
In this article, we show you how visual calculations work in Power BI, what advantages they offer and how to use them to analyze data more quickly and easily.
What are visual calculations in Power BI?
Visual calculations are a Power BI feature that allows you to create metrics directly on an existing visualization.
Until now, to calculate differences between periods, totals, or percentages, it was necessary to create measures using DAX (Data Analysis Expressions). With this new feature, Power BI generates most of the logic automatically through a visual interface.
This allows users with basic Power BI knowledge to do advanced analysis without needing to write code.
Why are they important?
Visual calculations reduce the complexity of data analysis and allow:
- Create advanced metrics quickly.
- Reduce errors in DAX formulas.
- Improve users' productivity.
- Get business insights in less time.
- Make analytical self-service easier within the organization.
Compare sales with last year without using DAX
One of the most common scenarios in any company is analyzing how sales have evolved compared to the same period last year.
Traditionally, this calculation required specific DAX measures and a proper calendar setup.
With visual calculations, the process is much easier.
Practical example
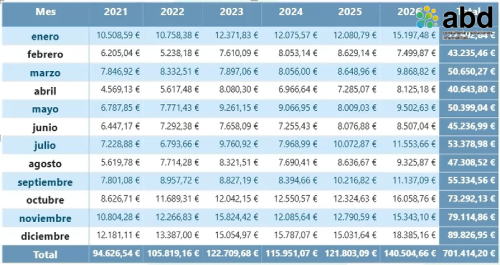
Let's imagine a Power BI matrix with:
- Months in rows.
- Years in columns.
- Sales as the main value.
When selecting the option New visual calculation, Power BI allows you to directly choose a comparison with the previous period.
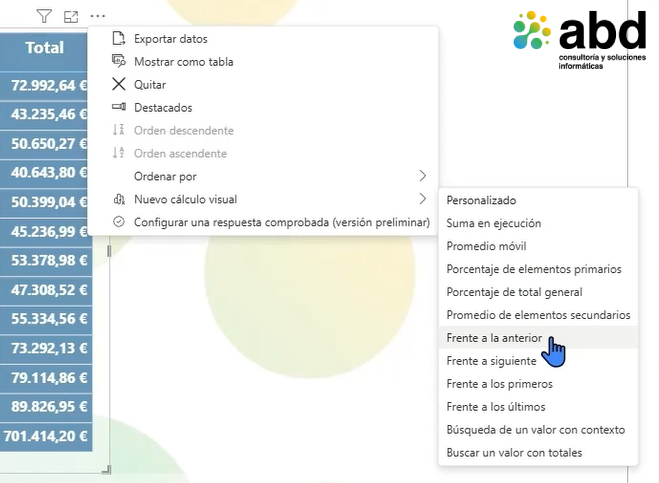
In just a few clicks, we get a new column that shows:
- Sales increases.
- Declines compared to last year.
- Monthly variations.
- Year-over-year trends.
All of this without needing to write a single line of DAX.
Benefits for business analysis
This type of comparison allows you to quickly answer questions like:
- Are we selling more than last year?
- Which months show the worst performance?
- Where should we focus our business efforts?
How to create monthly totals in Power BI
Another very common need is to visualize the cumulative sales evolution, billing or any other indicator.
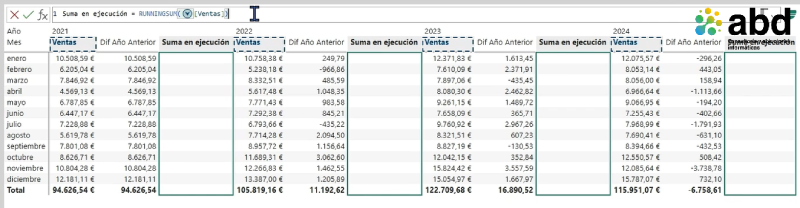
Thanks to visual calculations, Power BI includes the running sum functionality.
What is a cumulative sum
A running total shows how a value progresses over time.
For example:
- January: €10,000
- February: €20,000
- March: €35,000
- April: €50,000
Each period incorporates the value from previous months, allowing you to analyze the cumulative annual performance.
How to set it up
The procedure is very simple:
- Select the view.
- Click 'New visual calculation'.
- Choose the 'Running total' option.
- Select the sales measure.
- Confirm the calculation.
Power BI will automatically generate a new column with the corresponding total.
Advantages of visual calculations compared to DAX

Although DAX is still essential for advanced developments, visual calculations offer important advantages.
Lower learning curve
Users can generate complex analyses without any programming knowledge.
More speed
Many metrics can be set up in seconds.
Less dependence on the technical department
Business teams gain autonomy to analyze information.
Improved productivity
The time needed to build reports and dashboards is reduced.
Use cases where visual calculations add more value

This feature is especially useful in:
Sales analysis
- Year-over-year comparisons.
- Monthly evolution.
- Billing totals.
Finance
- Budget tracking.
- Comparison of expenses.
- Margin evolution.
Operations
- Production tracking.
- Quality indicators.
- Meeting goals.
Human Resources
- Template evolution.
- Analysis of absenteeism.
- Performance indicators.
Do visual calculations replace DAX?
The answer is no.
Visual calculations are designed to simplify common scenarios, but DAX is still fundamental for:
- Complex models.
- Custom calculations.
- Advanced business logic.
- Specific indicators.
However, for many everyday needs, this new feature takes away a big part of the technical complexity.
The future of data analysis in Power BI
Microsoft keeps betting on bringing data analysis closer to non-technical users.
The incorporation of artificial intelligence, Copilot, and the new visual calculations shows a clear trend: allowing any professional to generate advanced analyses without programming knowledge.
This speeds up the democratization of data within organizations and makes decision-making faster and more informed.
How ABD can help you get more out of Power BI

At ABD Consulting and IT Solutions We help companies turn their data into useful information for decision-making.
Our Power BI specialists they can help you to:
- Design custom dashboards.
- Automate business reports.
- Integrate data from different systems.
- Implement Power BI and Microsoft Fabric.
- Training users in data analysis and visualization.
If you want to take full advantage of Power BI and its new features, our team can support you in every phase of the project.
Visual calculations in Power BI represent an important advance for business users.
Now it's possible to create year-over-year comparisons, totals, and advanced analyses without needing to write complex DAX formulas. This lowers technical barriers, speeds up analysis, and lets you get valuable insights in just minutes.
If you haven't tried this feature yet, this is a good time to start. You'll see how many tasks that used to require advanced knowledge can now be handled with just a few clicks.
Do you want to improve your Power BI reports and take advantage of the latest Microsoft updates? Get in touch with ABD and we'll help you get the most out of your data.