

One of the most decisive factors in the adoption of a Power BI report is not the data model or the DAX, but how the user navigates through the information.
A report can be technically flawless and still feel confusing if the navigation is not well designed.
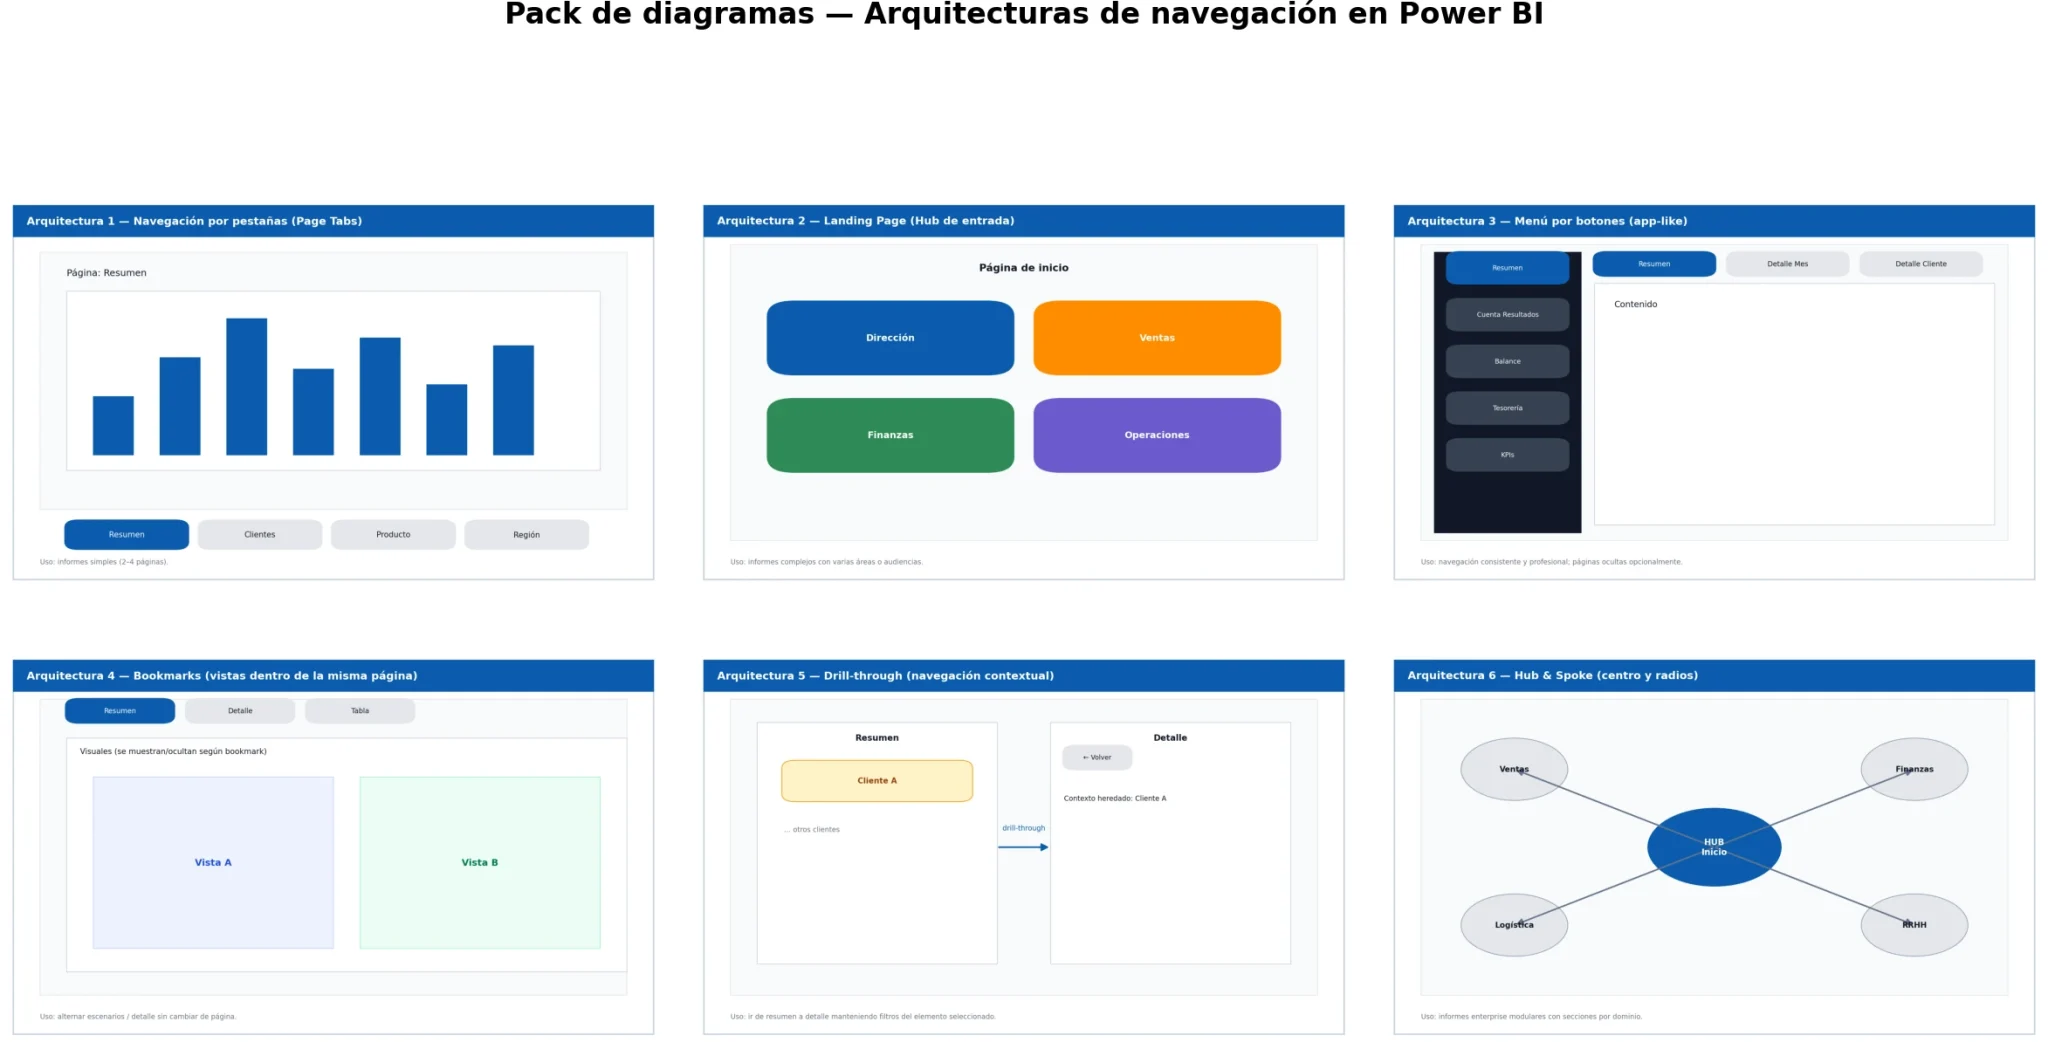
In this article, we review the main navigation architectures you can build in Power BI, when to use each one, and practical examples applied to real‑world scenarios.
Types of navigation in Power BI and when to use them
Standard Page Navigation in Power BI (Page Tabs)
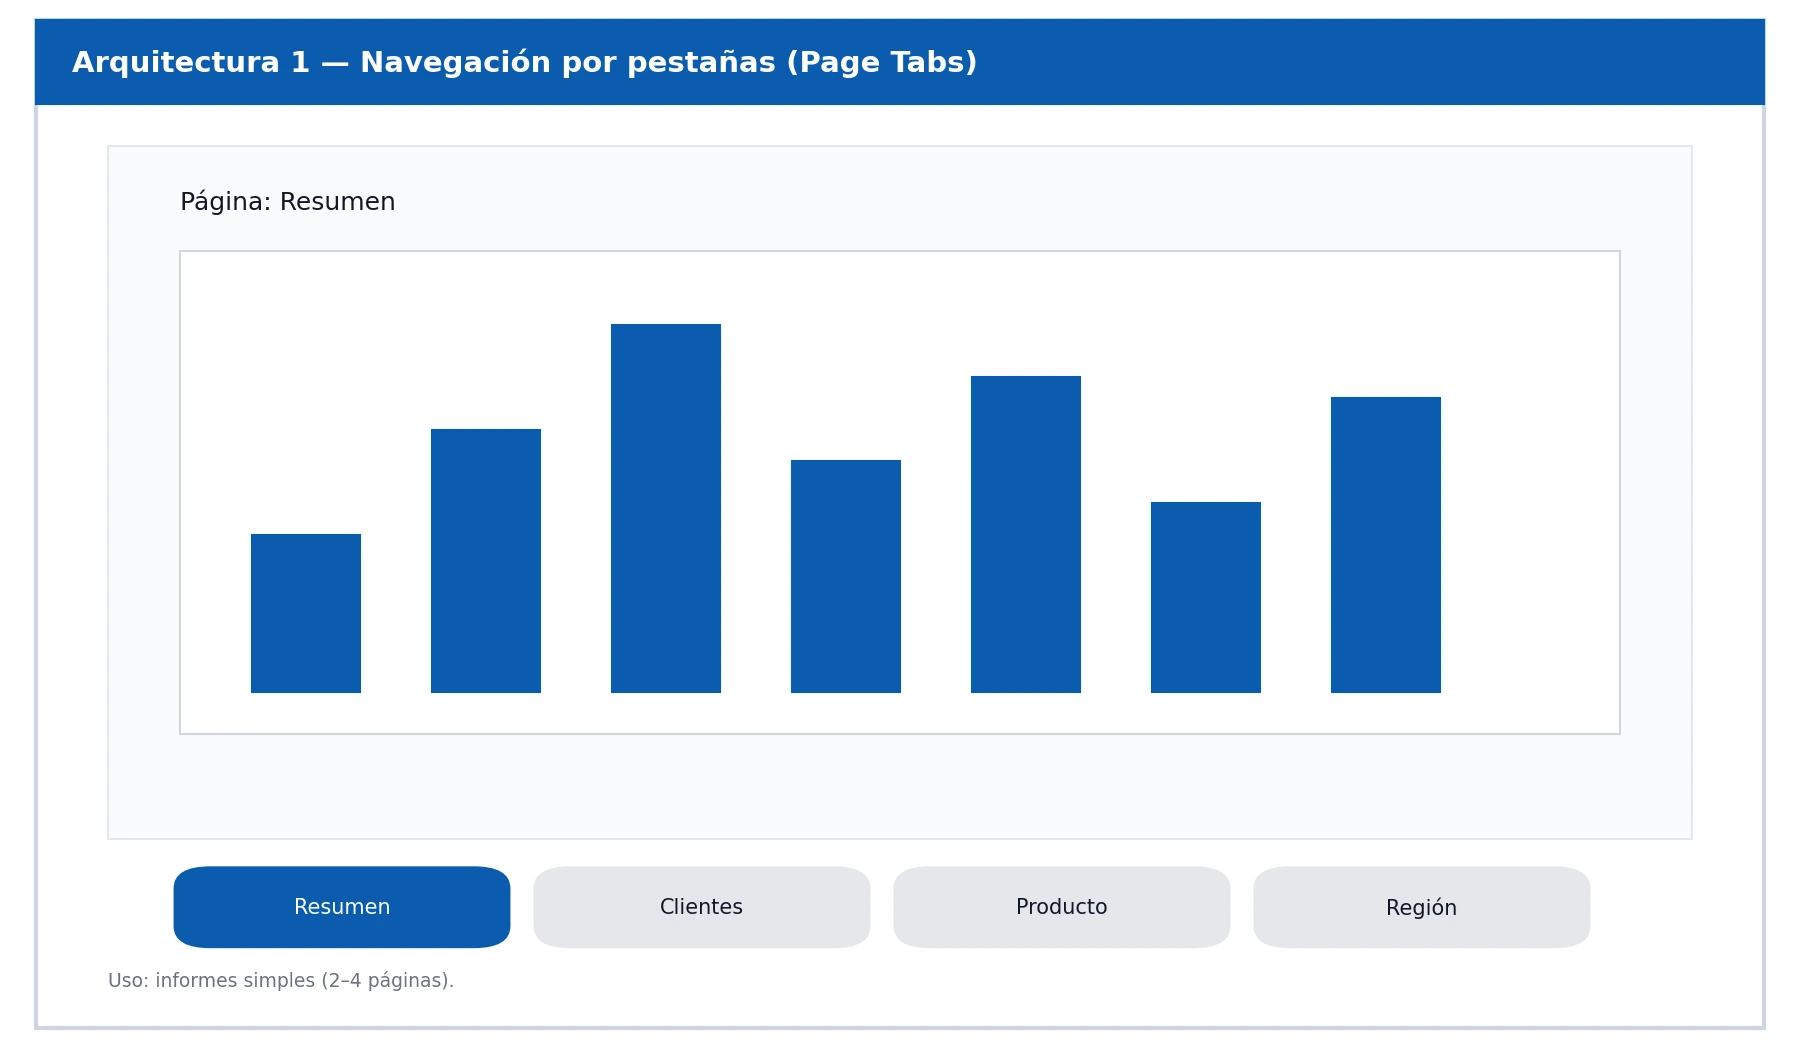
What is tab‑based navigation in Power BI?
It is Power BI’s native navigation method: the user switches views using the report’s bottom tabs.
When to use standard page navigation
- Very simple reports (2–4 pages)
- Non‑technical audiences
- Scenarios where page hierarchy is not critical
Advantages and limitations of tab navigation
Practical example
A basic sales report with:
- Global sales
- Sales by customer
- Sales by product
Each page answers a specific question, and there are no dependencies between them.
Advantages
- No additional configuration required
- Minimal maintenance
- Ideal for prototypes or quick internal reports
Limitations
- Provides little guidance for the user
- Does not reflect hierarchy or analytical flow
- Scales poorly as the report grows
Landing Page in Power BI: improving the user experience
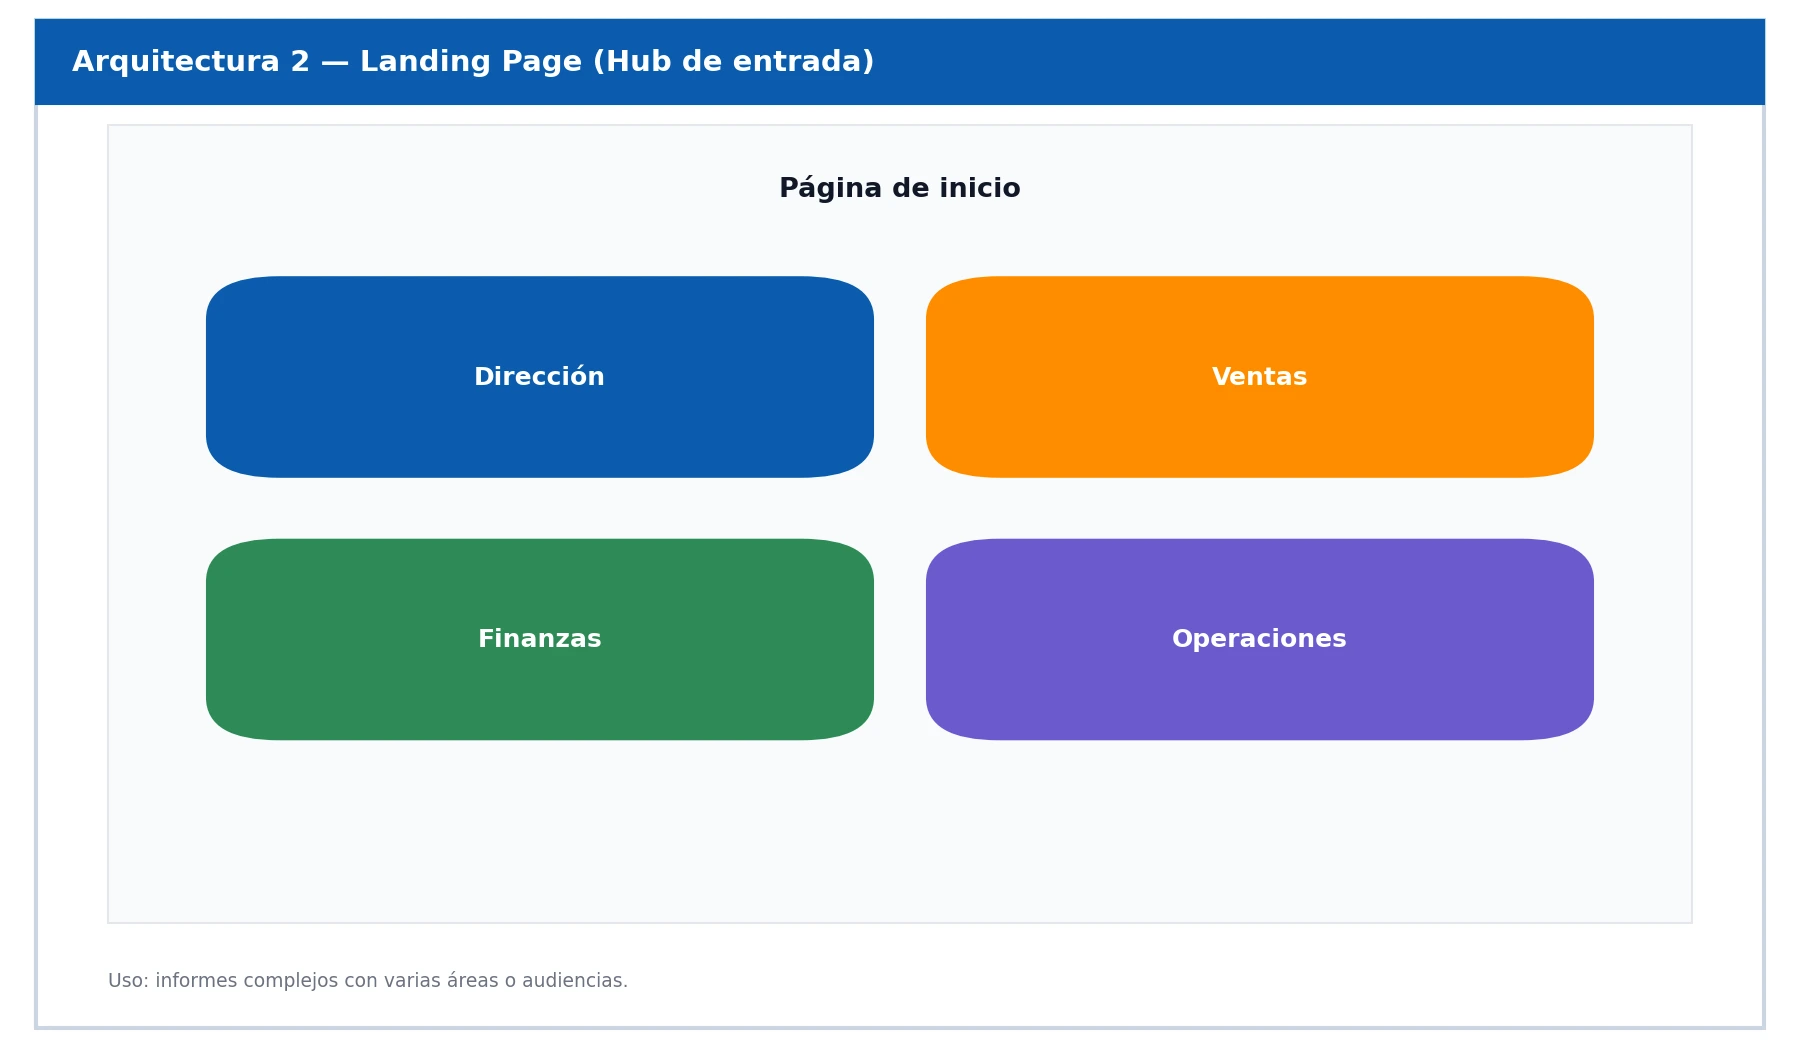
What is a landing page in Power BI?
The report starts on an initial page that acts as an entry point, from which the user accesses the rest of the sections through buttons.
When to use a landing page in Power BI reports
- Reports with many pages
- Multiple user profiles (management, sales, finance…)
- Need to guide the experience from the very first moment
Advantages and limitations of a landing page
Practical example
A corporate report with sections:
- Management
- Sales
- Finance
- Operations
Each button leads to a specific set of pages.
Advantages
- Improves the user experience
- Reduces the feeling of an “endless report”
- Facilitates onboarding
Limitations
- Adds an extra click
- Requires more visual design
Button‑based navigation in Power BI (custom menus)
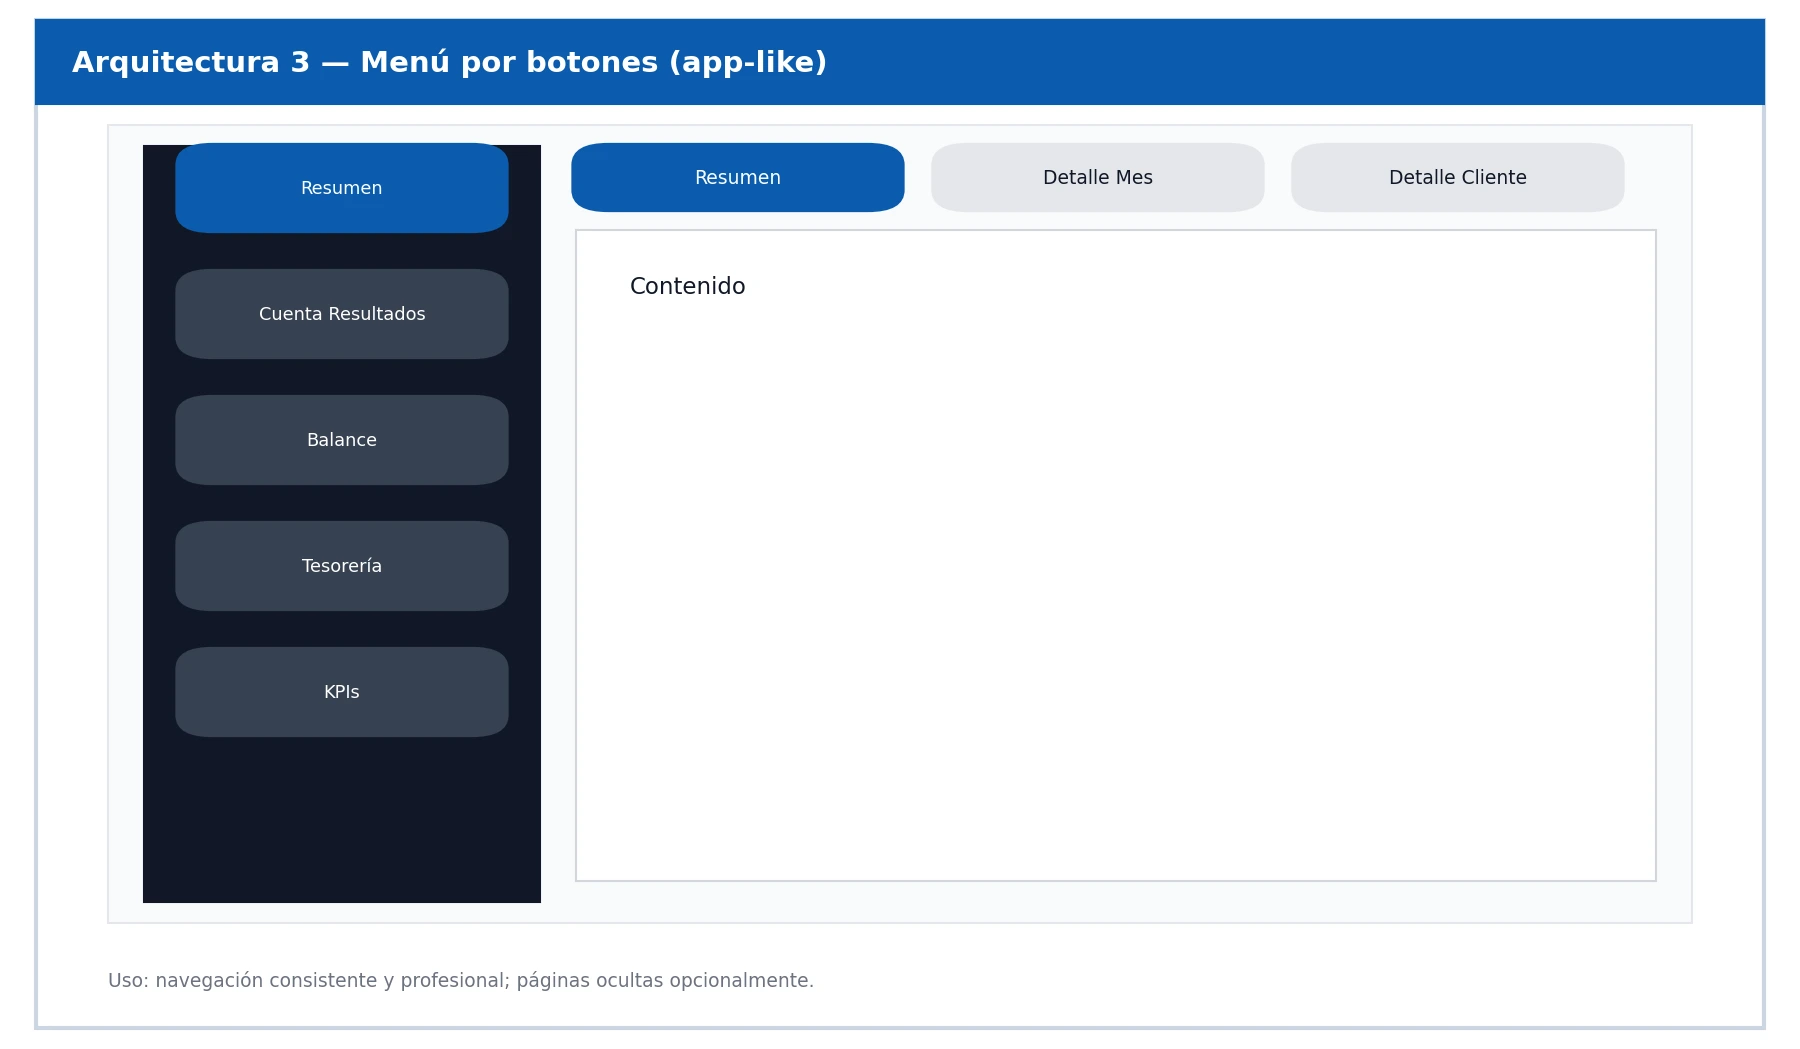
How to use buttons for navigation in Power BI
Using buttons configured to navigate between pages, simulating top menus, side menus, or custom tabs.
When to implement button‑based navigation
- Reports with strong corporate identity
- Cases where you want to hide the standard tabs
- Scenarios with frequent business use
Advantages and limitations of buttons in Power BI
A financial report with a fixed side menu:
- Profit & Loss
- Balance
- Cash Flow
- KPIs
The user always knows where they are.
Advantages
- Full control over the design
- App‑like experience
- Very intuitive for end users
Limitations
- Manual work required on every page
- Requires discipline to maintain consistency
Navigation with bookmarks in Power BI
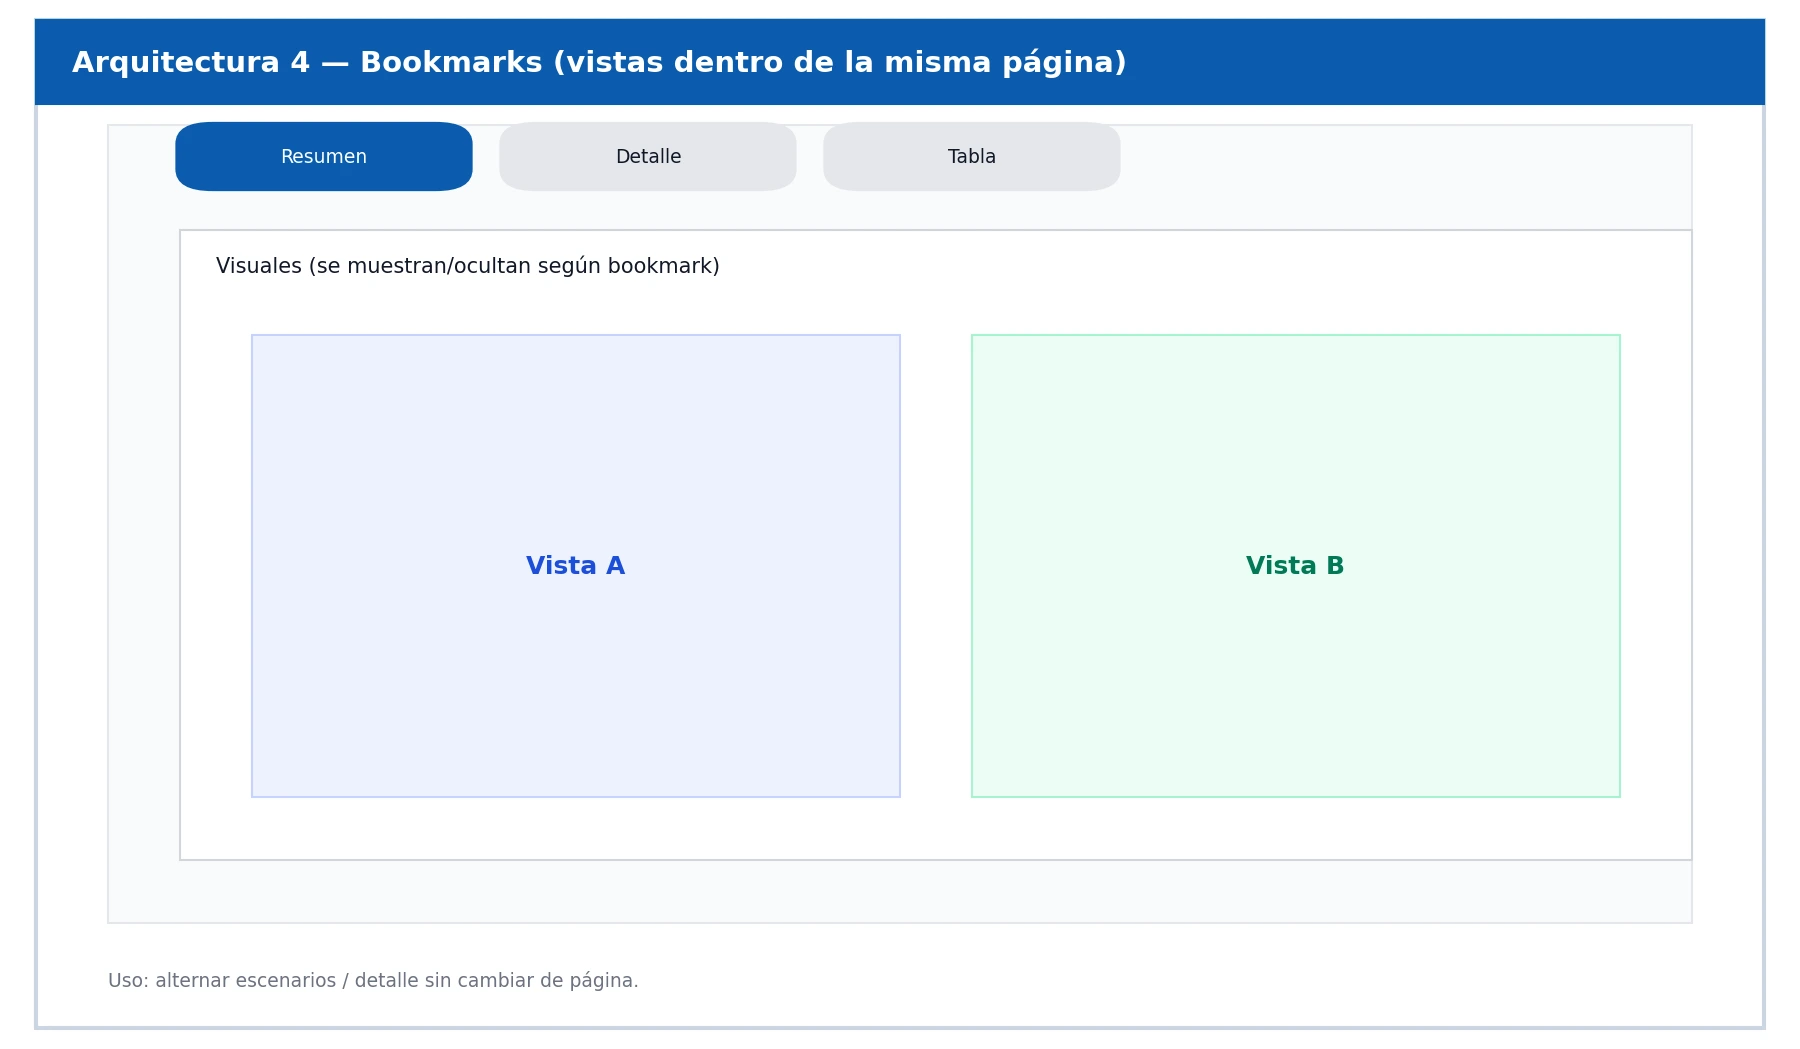
What are bookmarks in Power BI
Bookmarks save the state of a page (filters, visible visuals, selections) and allow switching between views without changing pages.
Use cases for bookmarks in reports
When to use them:
- Scenario comparison
- Show/hide detail
- Executive presentations
Advantages and limitations of bookmarks
Practical example
On a single page:
- Summary View
- Monthly Detail View
- Customer Detail View
A set of buttons switches between views using bookmarks.
Advantages
- Reduces the number of pages
- Smooth interaction
- Ideal for storytelling
Limitations
- Higher technical complexity
- Sensitive to uncontrolled changes
Drill‑through in Power BI: detailed analysis
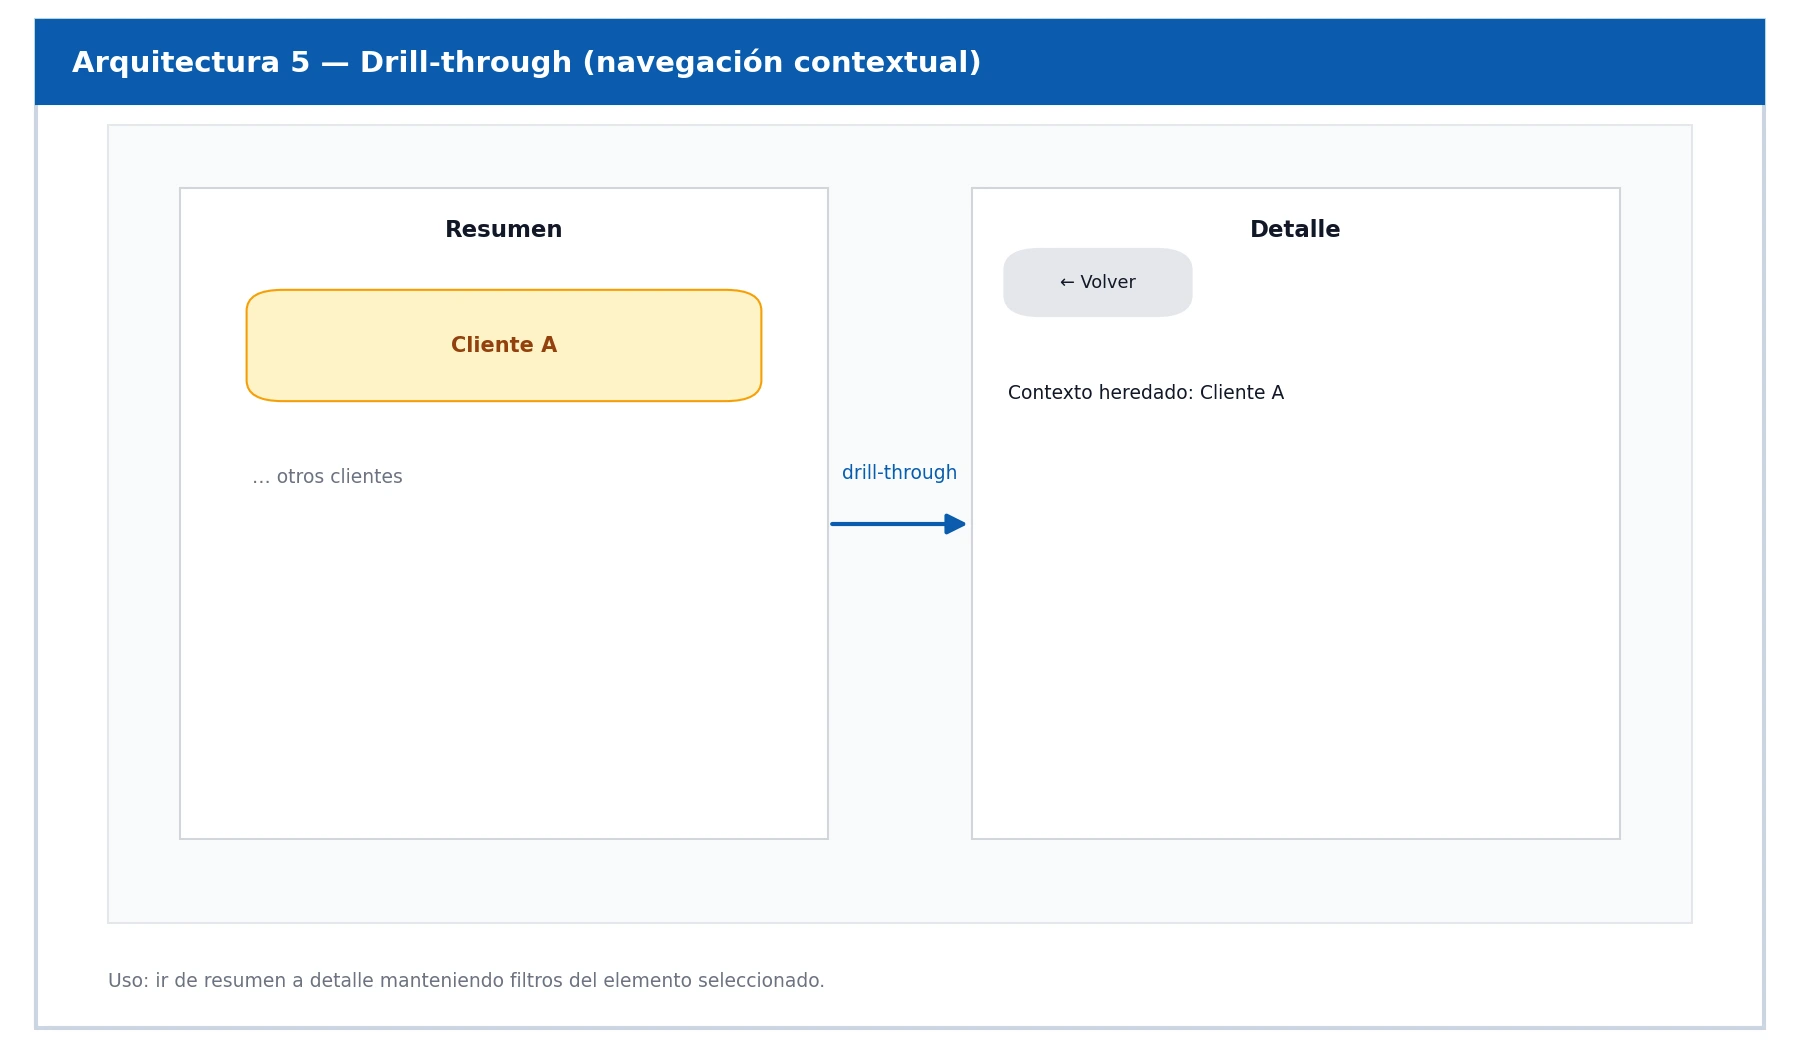
What is drill‑through in Power BI?
What does it do?
It allows you to navigate from a summary to a detailed page while keeping the context of the selected data (customer, product, region, etc.).
When to use drill‑through in Power BI
- Analytical reports
- Need to go into detail without overloading the summary
- Operational analysis scenarios
Advantages and limitations of drill‑through
Practical example
From a customer ranking, clicking on an item takes you to the detailed profile of the selected customer.
Advantages
- Context‑based navigation
- Automatically maintains filters
- Very powerful for analysis
Limitations
- Requires a clear design of destination pages
- Users must understand the interaction (button or right‑click)
Hub & Spoke Architecture in Power BI
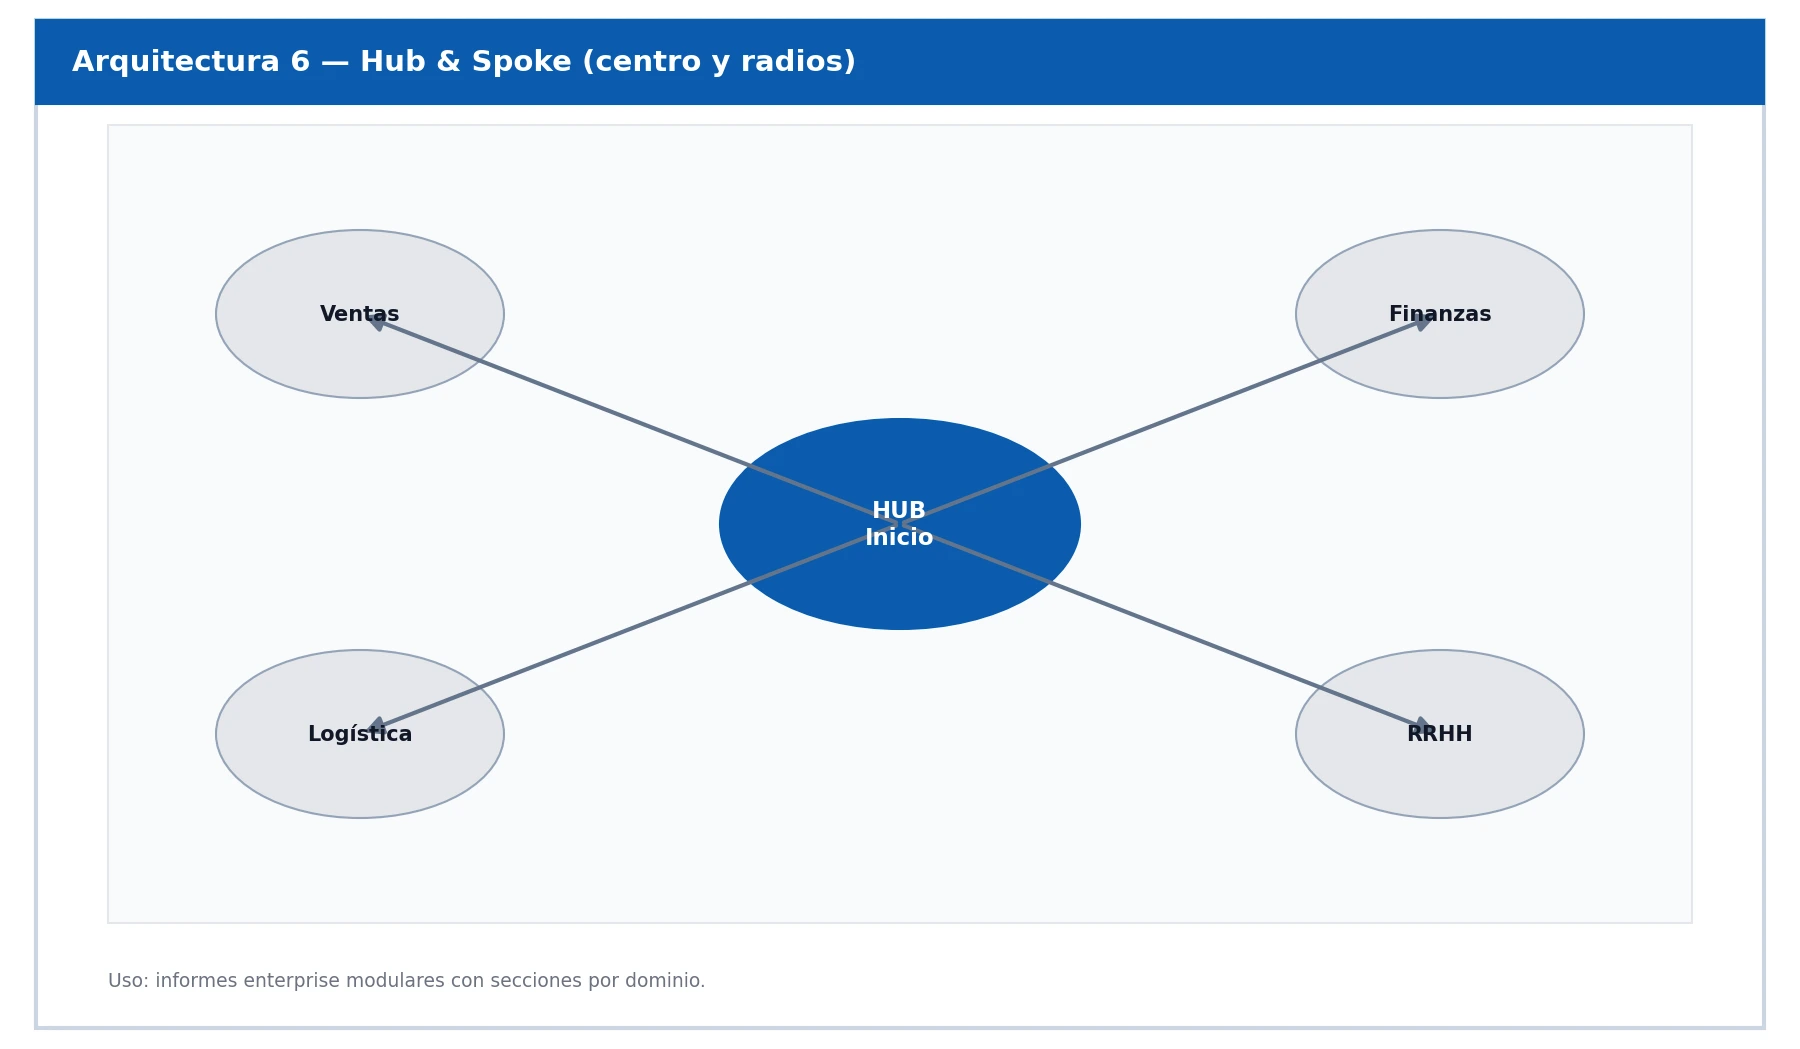
What is the Hub & Spoke model in reports?
An architecture where:
- A central page (Hub) provides access
- To multiple satellite pages (Spokes)
It combines landing pages + buttons + drill‑through.
When to use a Hub & Spoke architecture
- Complex corporate reports
- Enterprise‑level projects
- Reusable reporting models
Advantages and limitations of the Hub & Spoke model
Practical example
Hub: Global business overview
Spokes: Sales, Finance, Logistics, HR
Advantages
- Highly scalable
- Extremely clear structure
- Excellent user experience
Limitations
- Higher initial effort
- Requires design and governance
Power BI navigation best practices
- There is no single “correct” architecture
- Navigation must adapt to the user and the objective
- Power BI allows combining multiple methods in the same report
Tips for designing more intuitive Power BI reports
- Plan navigation before designing visuals
- Fewer pages is better (use bookmarks when appropriate)
- Always show the user where they are
- Include Back buttons in drill‑through pages
- Keep navigation consistent across all pages
- Design for the business user, not for the report author
ABD, your partner in Business Intelligence

At ABD Consulting and IT Solutions we help companies get the most out of their analytics tools such as Power BI by designing clear, intuitive, decision‑driven reports.
We have a team of experts in Business Intelligence, data analytics, and Microsoft solutions, supporting our clients from model definition all the way to dashboard optimization and user experience refinement.
If you want to improve the usability and impact of your Power BI reports, get in touch with us we’ll help you take the next step.